


Custom
Board
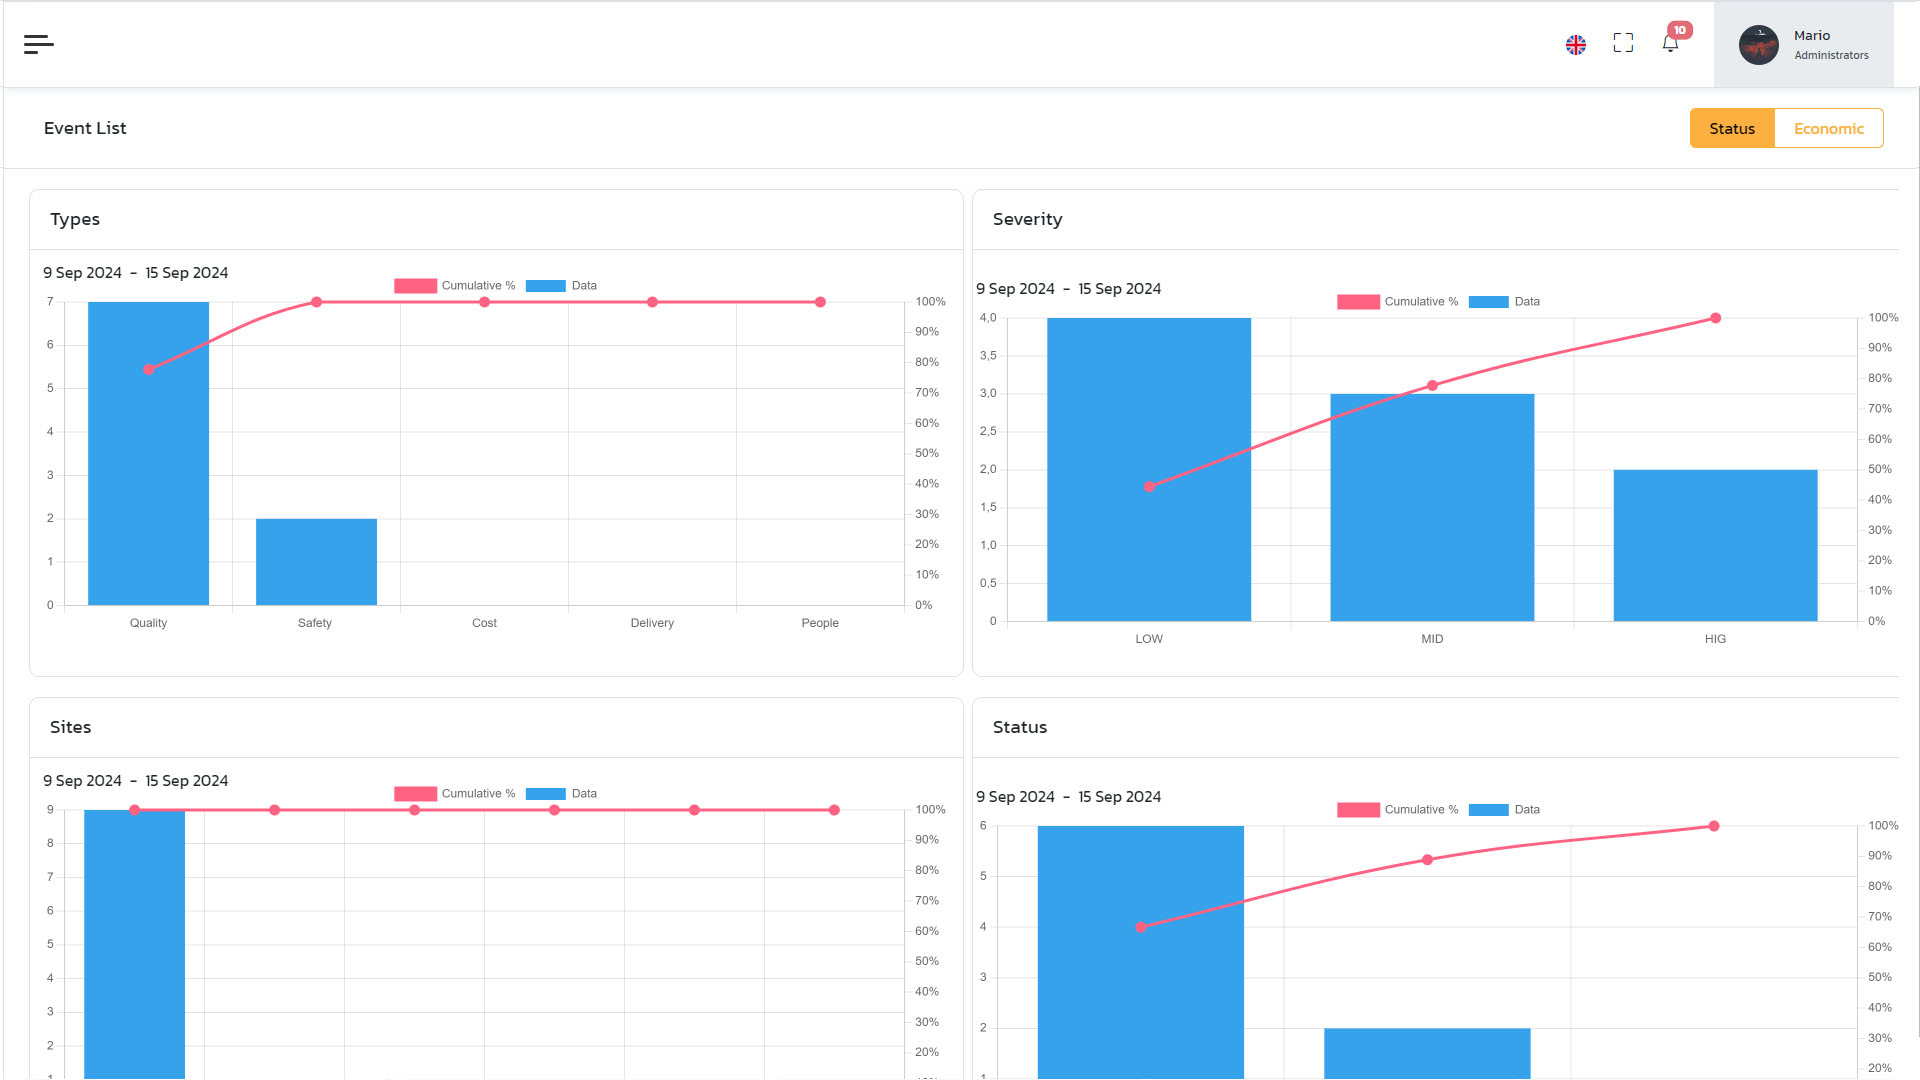
Real-time visualization of your KPIs
This module provides real-time visualization of key performance indicators (KPIs) and production data, enabling teams to quickly identify problems, monitor progress and make informed decisions. It improves transparency and supports a proactive approach to operations management.
- Operational Efficiency
- Data-Driven Decisions
- Real-Time KPI Monitoring


Visual Management Benefits
Visual Management makes processes transparent and shared, eliminating information silos and aligning everyone on objectives. Immediate access to key data enables data-driven and proactive decisions, reducing errors and delays. Real-time performance visualization increases operational efficiency, enabling rapid interventions on critical issues.
Charts and indicators highlight problems immediately, while automatic KPI monitoring ensures continuous control of progress against targets. Result: faster, coordinated and results-oriented operations.
Analytics & Reports
Each section has its own analytics, always having an updated picture of your plant.
Analysis of every data by sector, divided by operational and financial status.
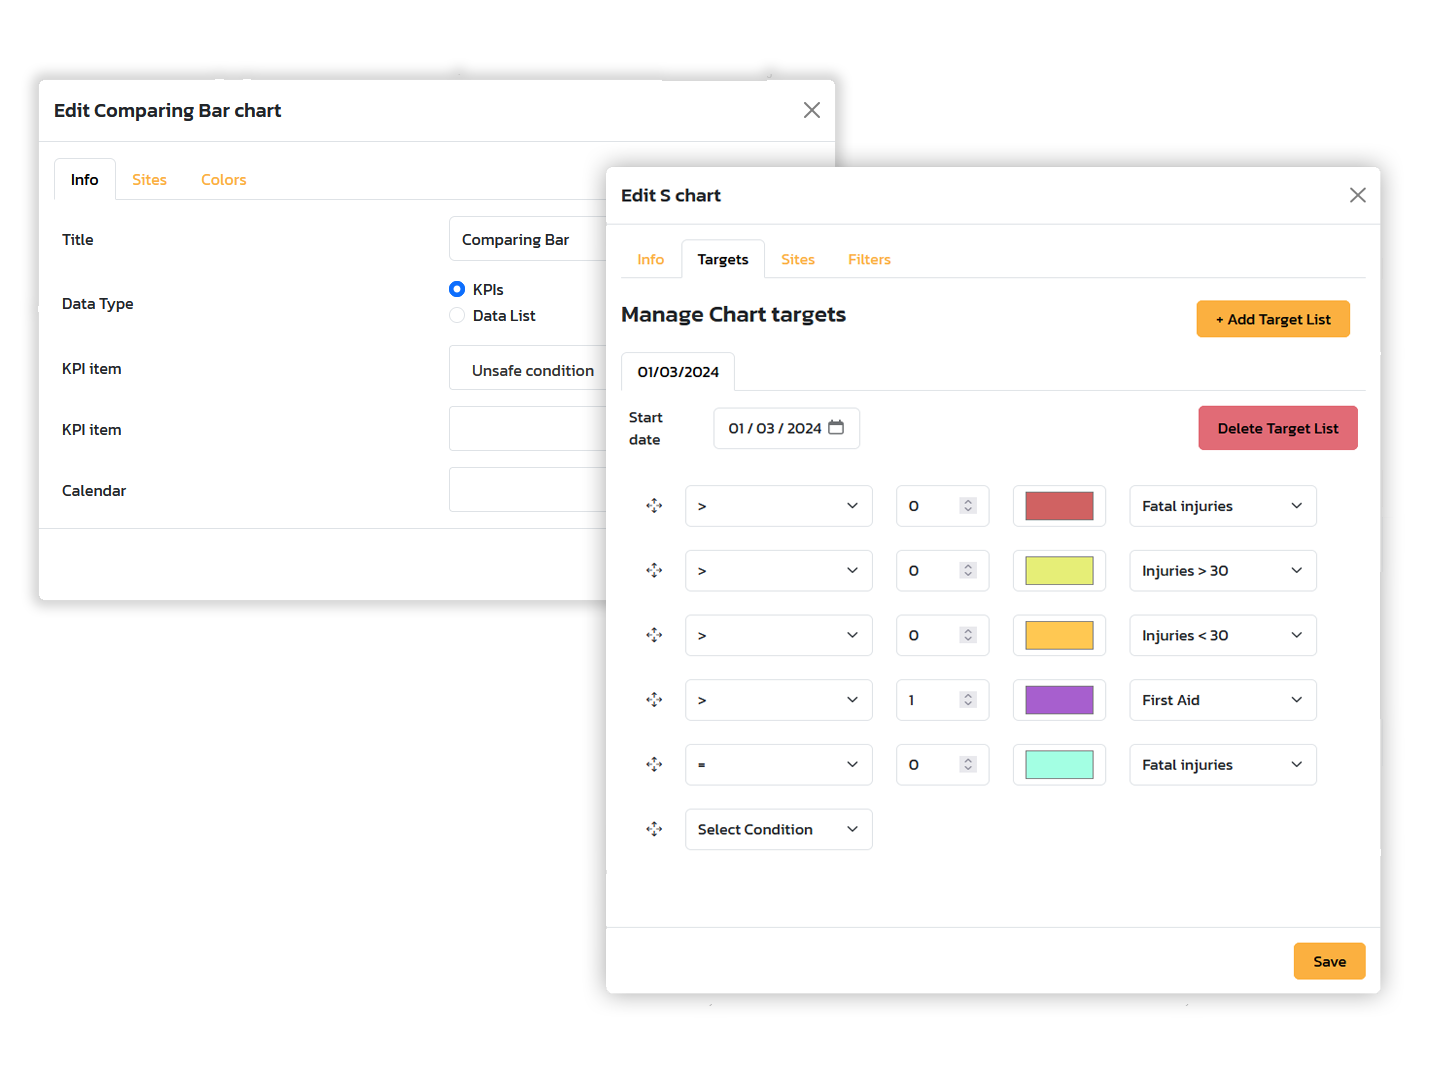
Board-Based Analytics
Access dynamic and customizable dashboards that transform data into immediate insights, allowing you to analyze business performance clearly and strategically.
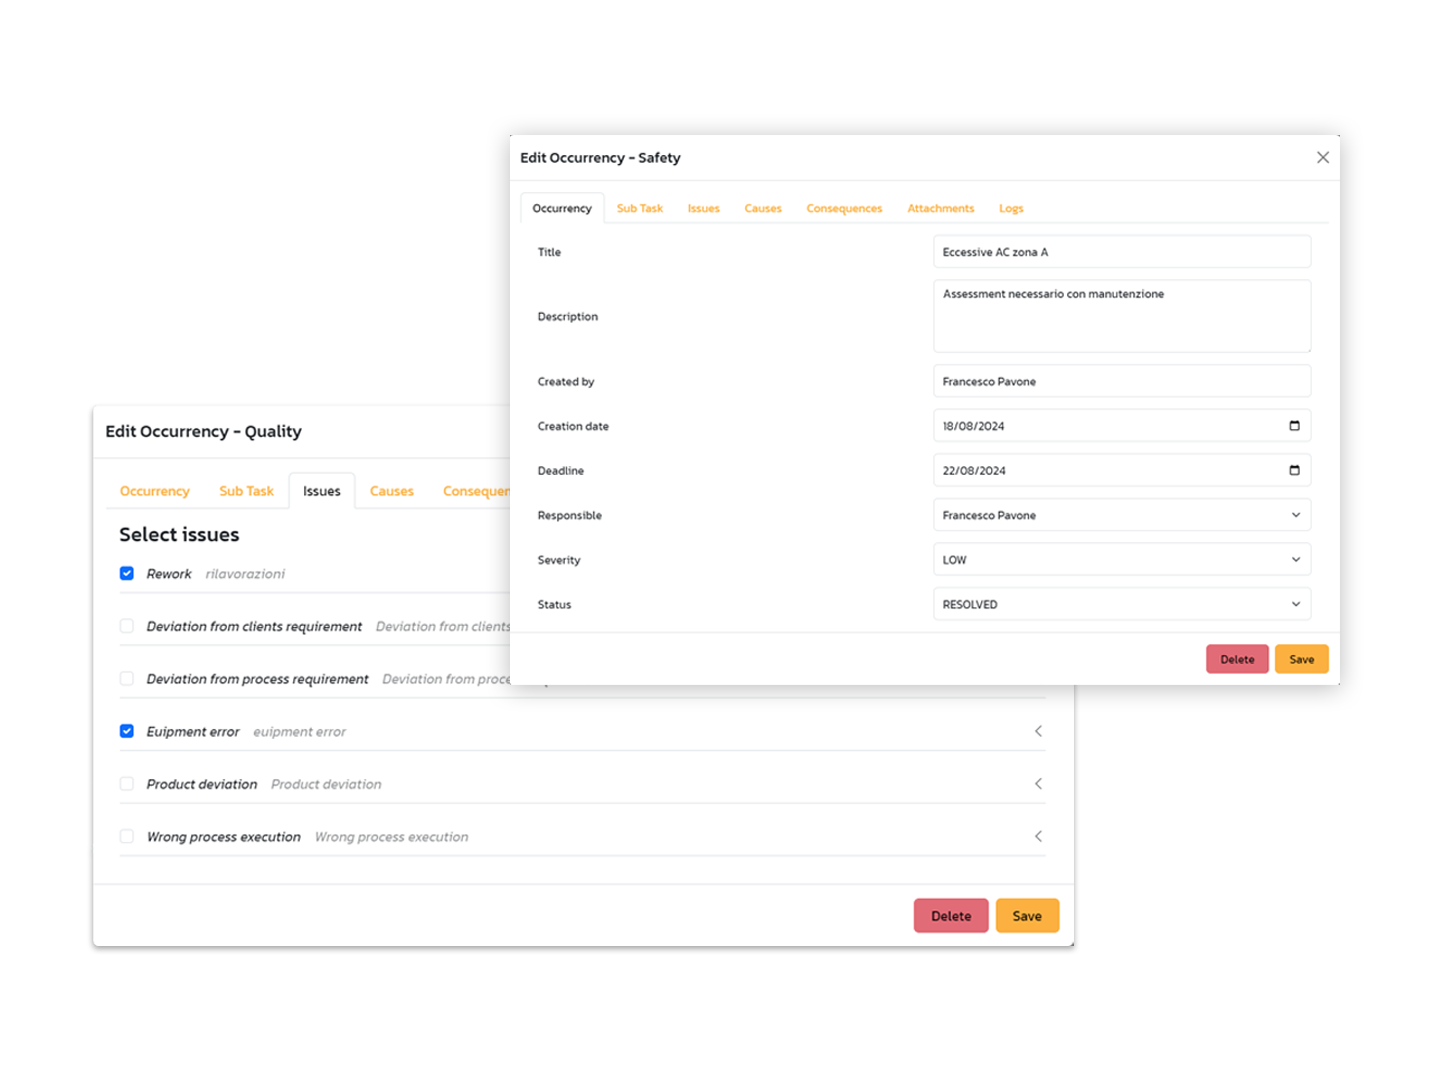
Occurrences Analytics
Monitor and analyze the frequency of events and occurrences in business processes, identifying recurring patterns and critical areas to intervene on to improve efficiency and reliability.
Suggestions Analytics
Get intelligent recommendations based on collected data to anticipate critical issues, optimize processes and support more effective strategic decisions.
Kaizen Analytics
Analyze data with a Kaizen approach to support continuous improvement, identifying growth opportunities and making processes increasingly lean and efficient.
Reports & Analytics Benefits
Advanced Reporting and Analytics
This functionality offers complete tools for reporting and data analysis, providing insights into various aspects of production. It enables users to generate customized reports, analyze trends and make data-driven decisions to optimize operations.