


View all data related to your facility.
- Company KPIs
- Custom Board
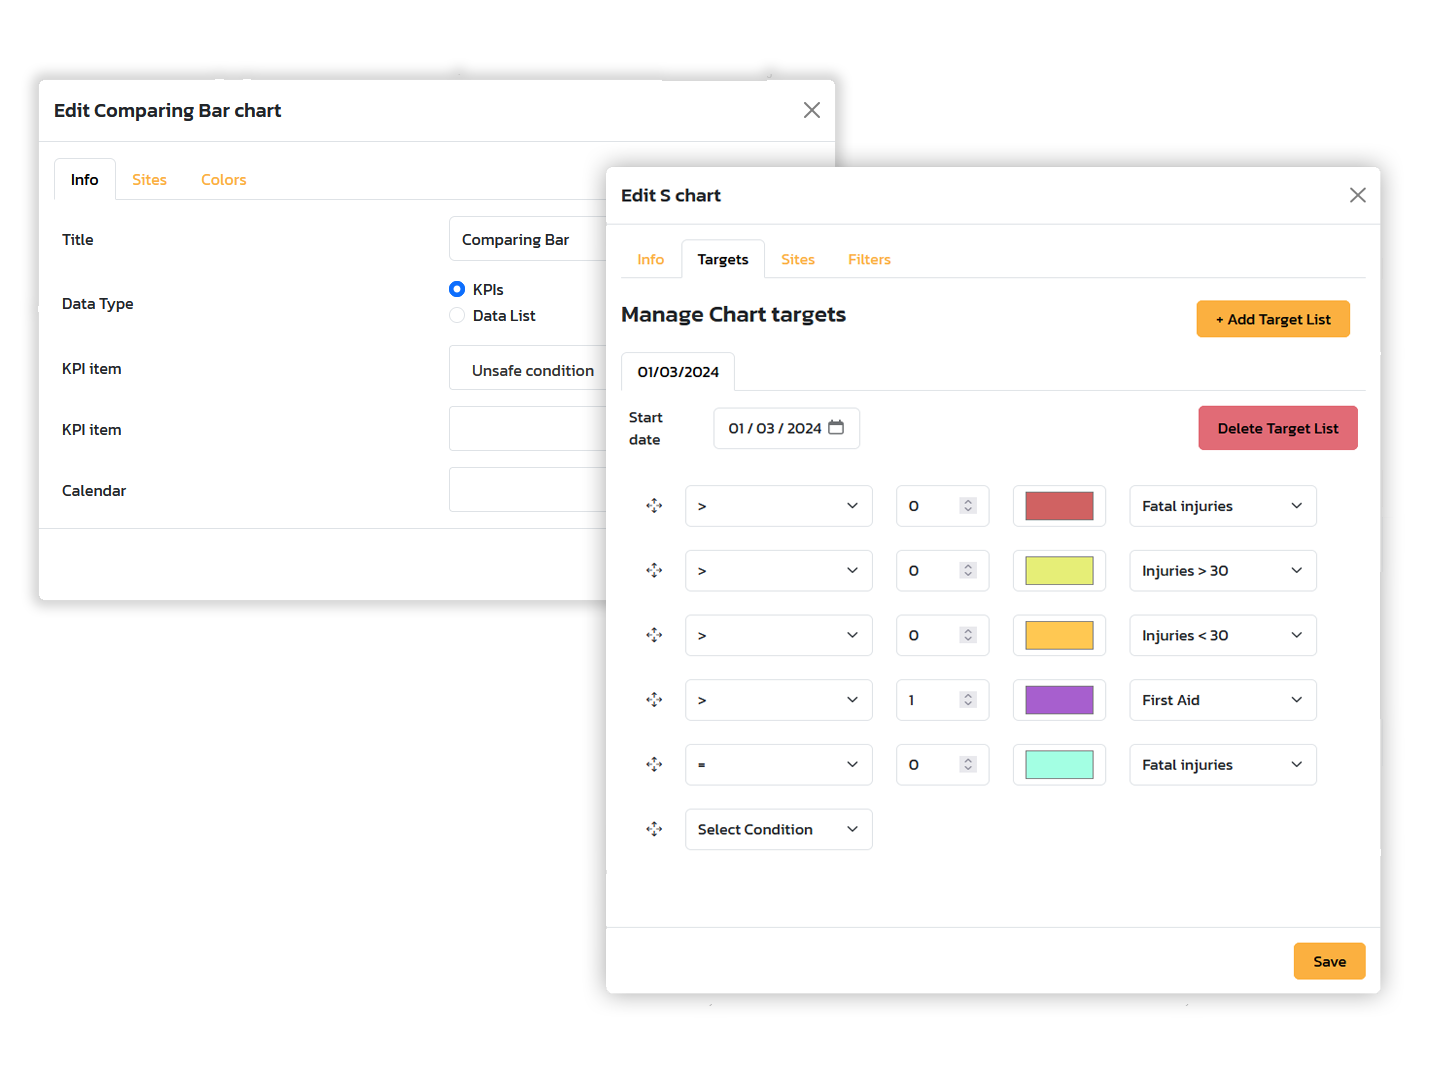
- Widgets & Charts
- Report & Analysis
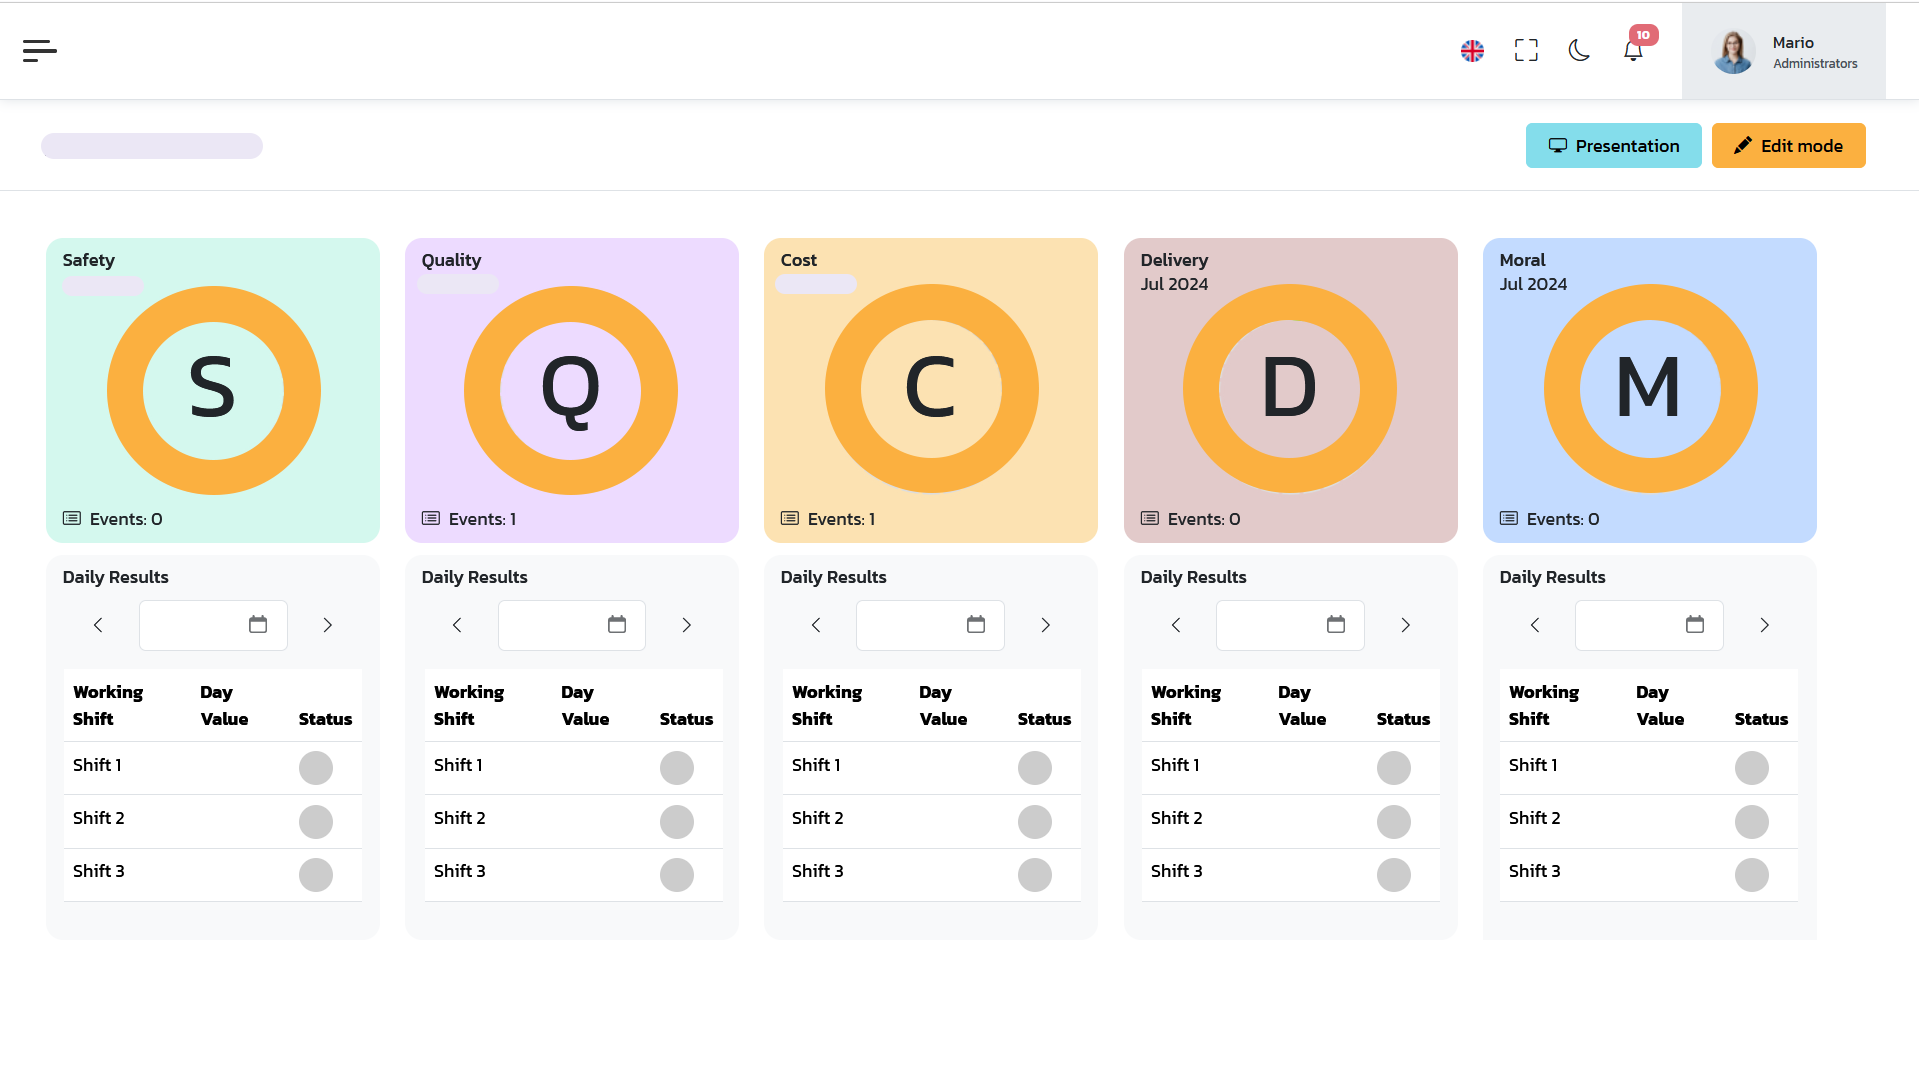
KPI real time monitoring
This module provides real-time visualization of key performance indicators (KPIs) and production data, allowing teams to quickly identify problems, monitor progress, and make informed decisions. It enhances transparency and supports a proactive approach to operations management.
Benefits of Visual Management
Data visualization promotes better communication between departments, reducing information silos and ensuring that everyone is aligned on goals and performance.
With quick access to crucial information, managers and teams can make more informed and proactive decisions, reducing the risk of errors or delays.
Real-time performance visualization allows for timely intervention on any issues, improving operational responsiveness and overall efficiency.
Through visual representations such as charts and diagrams, it is possible to quickly identify any anomalies or performance issues, allowing for timely interventions.
Key performance indicators are automatically updated, allowing teams to easily monitor progress against established goals.